This report was commissioned by UpLife Inc. and conducted independently by RED Digital Health Consulting. The evaluation was carried out in accordance with the ethical principles of the Declaration of Helsinki. All data were anonymized prior to analysis; users consented at sign-up to the use of anonymized data for ongoing evaluation of the app.
Introduction
Globally, mental health disorders are highly prevalent, with the World Health Organization estimating that around one in eight people live with a mental disorder at any given time (World Health Organization [WHO], 2022). Conditions such as depression and anxiety are among the leading contributors to global disability, significantly affecting individuals' quality of life, social functioning, and economic participation. Depression alone is a leading cause of disability worldwide, while anxiety disorders are among the most common mental health conditions, highlighting the scale and magnitude of the issue (WHO, 2022).
In response to these challenges, digital mental health applications have emerged as a promising tool for improving access to mental health support. These applications, typically delivered via smartphones or web-based platforms, offer a range of interventions, including cognitive behavioral therapy (CBT), mindfulness training, mood tracking, and psychoeducation. One of the key advantages of digital mental health apps is their accessibility; they can be used at any time and from any location, making them particularly valuable for individuals who may face barriers to traditional mental health services, such as cost, stigma, or limited availability of providers (Firth et al., 2017).
The scalability of digital interventions makes them especially relevant for addressing mental health needs at the population level. Digital tools can reach large numbers of users at relatively low cost. This is particularly important given the global shortage of mental health professionals. Furthermore, digital apps can facilitate early intervention by providing users with tools to manage symptoms before they escalate into more severe conditions.
Generally, people who use digital mental health interventions have found them acceptable. Most studies show moderate to high acceptability, often alongside variability in engagement and adherence (Fleming et al. 2018; Torous et al, 2014). A recent review of public digital mental health apps has recommended that consumer- and population-based apps for mental health are, in some cases, lacking evidence-based content, and many lack evidence-based research supporting their effectiveness (Baumel et al., 2020; Castro et al., 2024).
This study sought to develop preliminary evidence of effectiveness for a novel and innovative mental health app called UpLife.
Methods
Design
Using an observational pre–post design, real-world data (RWD) collection from 06/08/2021 to 04/12/2026 included participants' engagement and use of the UpLife digital mental health app, as well as outcome scores across three validated measures: PHQ-9, GAD-7, and WHO-5.
Participants
UpLife has attracted users from all major and minor geographies with genders across male, female, and non-specified. Most users come from English-speaking countries, including the USA, Canada, the UK, and Australia, in part because the product is available in English and Ukrainian. A large user base exists in Ukraine, where the app is localized and provided free of charge.
Inclusion & exclusion criteria
To examine factors associated with acceptability and engagement, all participants who used the app between 08/06/2021 and 04/12/2026 were included. A subset of users who provided data on clinical outcomes was included in the further analysis of the app's clinical effectiveness.
Recruitment strategy
UpLife follows a traditional acquisition approach that includes a multi-channel marketing campaign. Early efforts were jump-started via word of mouth and then app store keyword optimization. Users in the years 2021–2022 self-discovered UpLife because it met their search criteria or was recommended by algorithms.
In 2023, paid marketing was conducted on Google and Facebook ad platforms. Audiences were segmented based on socio-economic, gender attributes, and target conditions using search terms and myriad creatives. The most engaged segment was females aged 25–45, with a skew towards the older end.
During 2024–2025 UpLife partnered with a French app marketing agency and deployed a significant monthly ad budget that peaked at just over $100K/month for several consecutive months. This generated measurable user growth and sign-ups during this period of heavy market awareness. As of 2026, marketing has been reformulated because the company is now focused on the professional market (group practices and health systems).
Description of the digital mental health app
UpLife provides evidence-based psychological education and interventions based on the principles of Cognitive Behavioral Therapy (CBT). It does this using 5 major modalities: Journeys, Daily Plan, Mood Tracker, Interactive Chat, and Journaling.
Journeys are the core psychoeducational content and provide structure to the therapy. Each Journey is provided in both audio and written format and includes integrated exercises to draw attention and provoke positive change. Crucial to the success of CBT-based methodology is routine and ritual. The Daily Plan organizes the users' activities and shows them chronologically as a checklist. The app itself is proactive, reminding users at periodic intervals when certain activities are scheduled.
Mood check-ins are easy for users to accomplish in a minute and provide both mindfulness and data tracking. UpLife uses AI appropriately to detect trends in mood as related to activities and reflections. Used this way, the app surfaces both mind-traps and growth-mindset with attributes and insights. This valuable feedback is reinforcing.
Lila Chat (aka AI Assistant) provides the user with an easy, interactive way to share their current emotion or circumstance and have UpLife recommend content that may help guide them through their challenge. UpLife does not provide any AI-generated therapy; it only recommends content available on the platform.
Finally, the tool provides a complete Journal of all activities, check-ins, responses, and even a non-prompted Diary entry capability. Regularly reviewing the Journal reinforces their progress and helps users see their thinking patterns.
In addition to the 5 usage modalities, UpLife includes common psychological assessments such as GAD-7, PHQ-9, and WHO-5. The assessments are available to users who opt into a Personal Plan defined by the application and based on their onboarding survey. As the user progresses over time, additional recommendations for new plans may be presented based on usage signals.
Therapists and clinicians have a specialized product offering that builds on the consumer app by adding a dedicated therapist portal that is HIPAA-compliant. Through this portal, therapists can manage their clients, collaboratively assign, or modify their clients' Daily Plan, review mood and assessments, read reflections and journal entries (if permitted), and track progress. UpLife provides instructions on how to use the tool in a Blended Care Therapy model where face-to-face sessions are augmented with UpLife for between-session support. This integration and routine aim to enhance therapy gains while reducing cancellations and drop-offs.
UpLife maintains a catalogue of psychologist-created content appropriate for a wide variety of clinical and wellness conditions. A matrix is maintained that labels and weights each journey, meditation, and activity with a set of tags to classify each item across several dimensions.
During onboarding, participants are asked about the goals they hope to achieve with the app. They are further asked how they would like to achieve their goals, using examples such as developing better habits, practising mindfulness, and reflecting. Lastly, participants are asked to name any traumatic experience that has motivated their help-seeking and use of the app. Table 1 presents the associated data on goals, preferred methods for achieving the goals, and any difficult or traumatic experiences reported by participants at baseline. These represent three typical dimensions of CBT: desired cognitive/emotional outcomes sought (GOALS); behavioral interventions (METHODS); underlying schemas/triggers (TRAUMA). Using a weighting system for each item across the three domains, a simple algorithm recommends content during the initial user journey through the app, which is further developed over time based on the user's ongoing activity.
| Domain | Item | N | % |
|---|---|---|---|
| Goals | Self-confidence | 142,229 | 76.95% |
| Stress tolerance | 141,606 | 76.61% | |
| Happiness | 139,797 | 75.6% | |
| Recovery | 138,830 | 75.1% | |
| Motivation and energy | 137,186 | 74.4% | |
| Good relationships | 126,740 | 68.5% | |
| Self-realisation | 124,748 | 67.49% | |
| Productivity | 120,132 | 65% | |
| Sleep well | 7,158 | 3.87% | |
| Improve body image | 7,537 | 4% | |
| Methods | Develop habits | 131,550 | 71.1% |
| Reflect | 123,461 | 66.8% | |
| Perform practices | 116,176 | 62.8% | |
| Develop emotional intelligence | 108,795 | 58.8% | |
| Meditate | 98,743 | 53.4% | |
| Let the app decide for me | 75,148 | 40.6% | |
| Understanding self | 26,495 | 14.3% | |
| Take courses | 17,933 | 9.7% | |
| Keep a Diary | 14,267 | 7.7% | |
| Difficult / traumatic experiences reported at baseline | Moral injury | 65,975 | 35.7% |
| Other | 66,045 | 35.7% | |
| Breakup | 44,865 | 24.2% | |
| Moved to a new location | 36,079 | 19.5% | |
| Nothing bad has happened | 28,465 | 15.4% | |
| Physical violence | 17,961 | 9.7% | |
| Dismissal from work | 13,980 | 7.5% |
Data collection
Data on population include reach and take-up rates (i.e., those who downloaded the app and created an account) and early drop-off (i.e., no use beyond initial account creation). Data will include time spent in the intervention and the amount of intended intervention completed, collected using high thresholds of 80% and 100% to measure engagement and adherence to the app. Data on symptoms of distress and functioning, including depression (PHQ-9), anxiety (GAD-7) and general well-being (WHO-5) were included in the analysis to determine the clinical effectiveness of the app. All data was sourced from the UpLife app.
Outcome measures
Patient Health Questionnaire (PHQ-9) is a widely used, 9-item, self-administered diagnostic tool developed to screen for, diagnose, and monitor the severity of depression in both clinical and research settings. It is based directly on the nine diagnostic criteria for major depressive disorder outlined in the Diagnostic and Statistical Manual of Mental Disorders, Fourth Edition (DSM-5).
Generalised Anxiety Disorder (GAD-7) is a brief, self-report questionnaire designed to screen for Generalised Anxiety Disorder (GAD) and assess the severity of anxiety symptoms in clinical and research settings. It is based on the Diagnostic and Statistical Manual of Mental Disorders (DSM-5) criteria.
World Health Organisation (WHO-5) is a short, 5-item self-report questionnaire that assesses subjective psychological well-being over the past 2 weeks. It measures positive mood, vitality, and general interest, with high validity as a screening tool and an outcome measure in clinical research.
Statistical analysis
Descriptive statistics were used to report participants' baseline characteristics (e.g., age, gender, country of origin). Descriptive statistics also report participants' prior experiences with various mental health interventions (e.g., therapy, seminars, self-help materials).
Acceptability of the intervention was measured using population reach and take-up rates, and early dropout from take-up was used as a contraindicator. Descriptive data on engagement and adherence included time spent in the intervention and the amount of intended intervention completed, collected using high thresholds of 80% and 100% to measure engagement and adherence to the app.
Using linear mixed modelling, effectiveness was measured using clinical outcomes reported by users on standard, validated measures of depression symptoms (PHQ-9), anxiety symptoms (GAD-7), and general well-being (WHO-5).
Ethical considerations
At sign-up to the app, participants agreed that their anonymized data would be used for ongoing evaluation of the app to inform product and general usability improvements. The current report is an evaluation based on real-world data from app users. The evaluation was conducted in accordance with the ethical principles outlined in the Declaration of Helsinki.
Results
A. Descriptive statistics of the participants
The total number of users in the database is 516,489. Of these, 185,050 (35.82%) UpLife app users proceeded beyond just creating an account and are included in the following analysis.
15.5% (N=28,640) are fully paid app users who have subscribed via the app store, Play Store, or partner channels. Thirty-one per cent (31.6%; N=58,491) are users with full, free access to the app through the Ukraine Humanitarian Gift Program. Finally, 53% (N=97,919) are users with either free or limited access, those who never paid for the app and are currently on a free trial or have an expired one, but importantly, these users went beyond registering for an account and used the app.
Clinical data were collected for a subset of users using the Patient Health Questionnaire (PHQ-9), Generalized Anxiety Disorder (GAD-7), and World Health Organisation (WHO-5), see Table 2.
| Measure | Baseline | Post-intervention |
|---|---|---|
| PHQ-9 | N=868 | N=199 |
| GAD-7 | N=1300 | N=237 |
| WHO-5 | N=428 | N=108 |
Table 3 details the age and gender breakdown of the participants. The age ranges are mixed, as the system collected data across different ranges at different times over the six years of data collection (see Appendix C for full details). In addition to the 184,828 participants included in this evaluation of the platform, 62,428 provided information on their country of origin. Participants are represented from almost all countries across all continents. See Appendix B for the full list of countries represented.
| Category | Range | N | % |
|---|---|---|---|
| Age ranges | 13–19 | 2,036 | 1.1% |
| 18–29 | 3,394 | 1.83% | |
| 20–39 | 2,189 | 1.18% | |
| 35–40+ | 1,305 | 0.70% | |
| 45–50+ | 603 | 0.32% | |
| 55–65+ | 65 | 0.03% | |
| Not disclosed | 17 | 0.0% | |
| Missing | 175,441 | 94.8% | |
| Gender | Female | 145,839 | 83.2% |
| Male | 27,702 | 15.8% | |
| Non-binary | 1,514 | 0.9% | |
| Other | 40 | 0.0% | |
| Not disclosed | 95 | 0.1% |
During onboarding, participants were asked to indicate whether they had any previous experience with mental health or therapeutic interventions. Table 4 displays the associated data.
| Previous experience with… | N | % |
|---|---|---|
| New to psychology | 78,631 | 42.5% |
| Read books and articles | 50,759 | 27.4% |
| Met with a psychologist | 42,962 | 23.2% |
| Attend offline seminars | 719 | 0.39% |
| Currently in therapy | 1,089 | 0.58% |
| Use mental health apps | 2,014 | 1.0% |
B. Acceptability — reach and uptake
Between 06/08/2021 and 04/12/2026, 516,489 individuals created accounts on UpLife, indicating the app's reach. Of these, 185,050 (35.82%) UpLife app users went beyond creating an account and used the app for some period; a positive indication of uptake among those who reached the app and created an account.
C. Engagement
During onboarding, users answered questions about their goals, preferred methods for achieving them, and any recent difficult or traumatic experiences. These represent three typical dimensions of CBT: desired cognitive/emotional outcomes sought (GOALS); behavioral interventions (METHODS); underlying schemas/triggers (TRAUMA). Using a weighting system for each item across the three domains, a simple algorithm recommended content during the initial user journey through the app, which is further developed over time based on the user's ongoing activity.
Data from the first three journeys completed by this user group are reported. The intended duration of any journey in the app is between 7 and 15 days. The following details the number of days participants spend on their journeys. Examples of the journeys would be content on, for instance, stress management, overcoming anxiety, overcoming depression, getting over a breakup, etc. A full list of the different journeys users participated in can be found in Appendix D.
The following graph details the number of days (time spent) in users' journeys (Journey No. 1, N=123,237; Journey No. 2, N=22,630; Journey No. 3, N=44,079). Journey 1 dominates, especially around days 7 and 12. Journey 3 has strong peaks at 7, 9, and 12. Journey 2 is consistently smaller but follows a similar pattern.
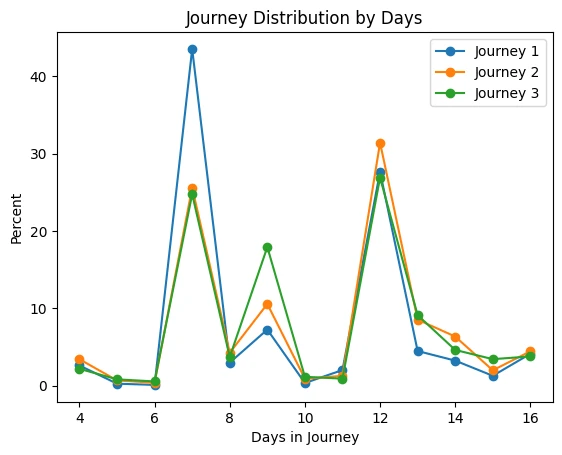
Most users (123,273; 66.6%) followed their initial journey and spent between 4 and 16 days using the app and consuming its content, completing exercises and practices. Interaction with the app is a key requirement for engagement. 46.52% of users used the app for 1 week, 48.03% for 2 weeks, and 5.42% for 15–16 days.
For the second and third journeys, there are fewer users, but their level of interaction is positive and spans 4 to 16 days. In the second journey, 22,630 (12.2%) users used the app. 68.72% used it for 1 week, 63.33% for 2 weeks, and 6.45% for 15–16 days. The third journey had 44,079 (23.8%) users, and 28.34% used the app for 1 week, 64.36% for 2 weeks, and 7.23% for 15–16 days.
D. Clinical effectiveness
Depressive symptoms
A series of linear mixed models (LMMs) was conducted to examine longitudinal changes in depressive symptoms, as measured by PHQ-9 scores, and the relationship between therapeutic engagement variables and depressive symptom outcomes. Across all models, participant ID was included as a random intercept, and time was modelled as a repeated effect using a diagonal covariance structure.
Across analyses, PHQ-9 scores decreased significantly over time, indicating improvements in depressive symptoms from baseline to follow-up. Estimated marginal means across models demonstrated reductions in PHQ-9 scores of approximately 2.0–3.7 points over time.
Engagement models
Initial models examined whether broader engagement indicators predicted PHQ-9 outcomes over time for those with baseline data (N = 868). Prior to running these specific models, models were conducted using available demographic (age, gender, country of origin) data as fixed factors to determine the impact of user demographics on outcome over time. All three factors were non-significant in this initial analysis and were therefore not incorporated into subsequent models.
A model including the total number of journeys undertaken demonstrated a significant interaction between time and the number of journeys undertaken, F(1,209.48)=10.70, p=.001. Fixed effects indicated that greater numbers of journeys undertaken were associated with larger reductions in depressive symptoms over time, with each additional journey associated with an approximately 0.25-point lower PHQ-9 score at follow-up (B = -0.248, p = .001).
Subsequent analyses examined sustained engagement using the number of completed journeys, with greater than 80% of journeys completed. This model also demonstrated a significant interaction between time and journeys completed to greater than 80%, F(2,312.05)=6.24, p=.002. Fixed effects indicated that each additional journey completed at greater than 80% was associated with an approximately 0.39-point reduction in PHQ-9 scores at follow-up (B = -0.387, p < .001).
A further model examining the number of journeys completed to 100% demonstrated the strongest engagement effect. The interaction between time and journeys completed to 100% was significant, F(2,310.38)=5.78, p=.003. Fixed effects indicated that each additional fully completed journey was associated with a reduction of approximately 0.41 points in PHQ-9 scores at follow-up (B = -0.407, p < .001).
Collectively, these findings suggested a dose–response relationship whereby deeper and more sustained engagement with therapeutic content was associated with greater reductions in depressive symptoms.
Final adjusted model
A final adjusted model was then conducted, including:
- depression journey completion status,
- number of journeys completed to 100%,
- and subscription access level (full access vs limited access).
In this model, PHQ-9 scores continued to decrease significantly over time, F(1,284.43)=12.13, p<.001. Estimated marginal means demonstrated a reduction in PHQ-9 scores from 16.04 (95% CI: 15.24–16.85) at baseline to 12.35 (95% CI: 10.57–14.12) at follow-up, representing an average reduction of approximately 3.69 points.
The number of journeys completed to 100% remained a significant predictor of PHQ-9 scores after adjustment for other variables, F(1,466.87)=9.96, p=.002. Fixed effects indicated that each additional journey completed to 100% was associated with an estimated 0.30-point lower PHQ-9 score (B = -0.301, SE = 0.133, p = .025, 95% CI: -0.563 to -0.039).
Depression journey completion demonstrated a significant overall effect in the Type III tests, F(1,324.66)=18.09, p<.001, although the individual fixed-effect coefficient was attenuated after adjustment for other engagement variables (B=−2.80, p=.065). Subscription access level (full access vs limited access) was not a significant predictor of PHQ-9 outcomes after accounting for engagement intensity, F(1,244.14)=0.31, p=.580. Likewise, the interaction between time and subscription access was non-significant, F(1,244.14)=0.002, p=.965.
No significant interactions were observed between time and depression journey completion, F(1,324.66)=1.01, p=.317, or between time and journeys completed to 100%, F(1,466.87)=0.17, p=.678. These findings suggest that while greater engagement intensity was associated with lower depressive symptom severity overall, rates of improvement over time were broadly comparable across groups once multiple engagement variables were simultaneously accounted for.
Overall, the findings indicate that depressive symptom improvement was associated more strongly with the depth and completeness of therapeutic engagement than with subscription access alone, see Table 5.
| Engagement variable | Model effect | Approximate PHQ-9 change |
|---|---|---|
| Journeys undertaken | Significant time × engagement interaction (p = .001) | ~0.25-point lower PHQ-9 per additional journey undertaken |
| Journeys completed >80% | Significant time × engagement interaction (p = .002) | ~0.39-point lower PHQ-9 per additional journey completed >80% |
| Journeys completed 100% (unadjusted model) | Significant time × engagement interaction (p = .003) | ~0.41-point lower PHQ-9 per additional fully completed journey |
| Journeys completed 100% (final adjusted model, including subscription type) | Significant main effect (p = .025) | ~0.30-point lower PHQ-9 per additional fully completed journey |
Anxiety symptoms
Three linear mixed models were conducted to examine changes in anxiety symptoms over time and the association between engagement with the platform and GAD-7 outcomes in those who completed a GAD-7 at baseline (N=1305). Across all models, fixed effects included time, anxiety journey completion status, and subscription access level (full access vs limited access). Separate models additionally included one of the following engagement covariates: (1) number of journeys undertaken, (2) number of journeys completed to ≥80%, and (3) number of journeys completed to 100%.
Across all three models, a significant main effect of time was observed, indicating that GAD-7 scores decreased significantly from baseline to follow-up. Estimated marginal means showed reductions from approximately 12.6 at Time 1 to approximately 10.6–10.8 at Time 2 across models.
In Model 1, the number of journeys undertaken was significantly associated with lower GAD-7 scores, F(1, 527.22) = 9.39, p = .002. Parameter estimates indicated that each additional journey undertaken was associated with a reduction of approximately 0.16 points in the GAD-7 score (B = -0.162, p = .015).
In Model 2, the number of journeys completed to ≥80% was also significantly associated with lower GAD-7 scores, F(1, 499.78) = 5.66, p = .018. Parameter estimates indicated that each additional journey completed to ≥80% was associated with a 0.15-point reduction in GAD-7 score (B = -0.154).
Similarly, in Model 3, the number of journeys completed to 100% was significantly associated with lower GAD-7 scores, F(1, 495.75) = 6.44, p = .011. Each additional fully completed journey was associated with an approximate 0.17-point reduction in GAD-7 score (B = -0.173, p = .048).
Subscription access was also a significant predictor across all GAD-7 models, with full access users demonstrating lower adjusted anxiety scores than limited access users. However, anxiety journey completion status itself was not independently associated with GAD-7 outcomes after controlling for engagement variables.
No significant interaction effects were observed between time and engagement variables, nor between time and subscription access, suggesting that reductions in anxiety symptoms occurred broadly across groups rather than differing significantly by engagement intensity or access level (see Table 6).
| Model | Engagement variable | Estimate (B) | p-value | Interpretation |
|---|---|---|---|---|
| Model 1 | Journeys undertaken | -0.162 | .015 | Each additional journey undertaken was associated with a 0.16-point lower GAD-7 score |
| Model 2 | Journeys completed ≥80% | -0.154 | .018* | Each additional ≥80% completed journey was associated with a 0.15-point lower GAD-7 score |
| Model 3 | Journeys completed 100% | -0.173 | .048 | Each additional fully completed journey was associated with a 0.17-point lower GAD-7 score |
Improvements in wellbeing
Three equivalent linear mixed models were conducted to examine changes in well-being outcomes using the WHO-5 Well-being Index among those with baseline data (N = 428). Unlike the PHQ-9 and GAD-7 analyses, no significant main effect of time was observed in the WHO-5 models, indicating that well-being scores did not improve significantly between baseline and follow-up.
Similarly, none of the engagement covariates was significantly associated with WHO-5 outcomes. The number of journeys undertaken, journeys completed to ≥80%, and journeys completed to 100% were all non-significant predictors of wellbeing outcomes. Subscription access level and wellbeing journey completion status were also not significantly associated with WHO-5 scores across models.
Although descriptive estimated marginal means generally trended in the expected direction, with slightly higher well-being scores observed over time and among users with greater engagement, confidence intervals were wide, and variability was substantial. The WHO-5 analyses were also conducted on a smaller sample (n = 428) than the PHQ-9 and GAD-7 analyses (n = 1305), which may have reduced the statistical power to detect smaller effects. No significant interaction effects between time and any engagement or subscription variables were observed in the WHO-5 models, see Table 7.
| Model | Engagement variable | Estimate (B) | p-value | Interpretation |
|---|---|---|---|---|
| Model 1 | Journeys undertaken | +0.499 | .137 | Non-significant association with WHO-5 scores |
| Model 2 | Journeys completed ≥80% | +0.613 | .122 | Non-significant association with WHO-5 scores |
| Model 3 | Journeys completed 100% | +0.641 | .134 | Non-significant association with WHO-5 scores |
Overall, findings suggest that greater platform engagement was consistently associated with lower depression and anxiety symptom severity, whereas associations with broader wellbeing outcomes were weaker and non-significant within the present sample.
Secondary analysis
Secondary exploratory analyses examined whether broader indicators of platform engagement were associated with clinical outcomes over time. Specifically, linear mixed models were used to compare the relative contribution of overall platform exposure ("total days used") and engagement with therapeutic content ("journey days completed") across depression (PHQ-9), anxiety (GAD-7), and wellbeing (WHO-5) outcomes.
Across outcomes, a consistent pattern emerged: journey-based engagement metrics showed stronger, more consistent associations with clinical outcomes than overall platform usage duration. In several models, total days used were no longer significantly associated with outcomes after accounting for journey engagement, suggesting that progression through therapeutic content may represent a more meaningful indicator of engagement than general platform exposure alone. Results from these exploratory analyses are summarized in Table 8.
| Outcome | Model | Time effect F (p) | Engagement predictor | Engagement effect F (p) | Interaction effect F (p) | Key interpretation |
|---|---|---|---|---|---|---|
| PHQ-9 | Total days used | 26.18 (<.001) | Total days used | 5.07 (.025) | 2.90 (.090) | Greater overall app use is associated with lower PHQ-9 scores, but not significantly associated with greater symptom improvement over time |
| PHQ-9 | Journey days completed | 22.42 (<.001) | Journey days completed | 12.11 (<.001) | 4.43 (.037) | Greater therapeutic journey engagement is associated with significantly greater reductions in depression over time |
| PHQ-9 | Combined model | 18.38 (<.001) | Total days used | 0.37 (.544) | 0.71 (.399) | Total app use is no longer significant after accounting for therapeutic engagement |
| Journey days completed | 7.81 (.005) | 2.08 (.150) | Therapeutic engagement remained significantly associated with lower PHQ-9 scores | |||
| GAD-7 | Total days used | 29.01 (<.001) | Total days used | 7.59 (.006) | 1.19 (.276) | Greater app use is associated with lower anxiety overall, but not differential symptom change |
| GAD-7 | Journey days completed | 20.51 (<.001) | Journey days completed | 21.18 (<.001) | 6.69 (.010) | Greater therapeutic engagement associated with significantly greater reductions in anxiety symptoms over time |
| GAD-7 | Combined model | 18.33 (<.001) | Total days used | 0.15 (.696) | 0.01 (.933) | General platform exposure no longer significant after accounting for therapeutic engagement |
| Journey days completed | 13.40 (<.001) | 5.46 (.020) | Therapeutic engagement remained significantly associated with lower GAD-7 scores and greater symptom improvement | |||
| WHO-5 | Total days used | 1.47 (.227) | Total days used | 0.34 (.559) | 0.04 (.835) | No significant association between total platform use and wellbeing outcomes |
| WHO-5 | Journey days completed | 1.49 (.225) | Journey days completed | 10.56 (.001) | 2.84 (.093) | Greater therapeutic engagement is associated with higher wellbeing scores overall |
| WHO-5 | Combined model | 1.28 (.259) | Total days used | 0.02 (.882) | 0.01 (.920) | Total platform exposure remained non-significant |
| Journey days completed | 12.95 (<.001) | 1.67 (.198) | Therapeutic engagement remained significantly associated with better wellbeing outcomes |
Overall, findings suggest that greater platform engagement was consistently associated with lower depression and anxiety symptom severity, whereas associations with broader wellbeing outcomes were weaker and non-significant within the present sample.
Discussion
The present study sought to evaluate the acceptability, engagement, and clinical effectiveness of a digital mental health application within a large, naturalistic user population. We provide support for our three hypotheses, along with important limitations that reflect broader challenges in implementing digital interventions at scale.
Acceptability
In the context of UpLife as a population-level intervention for mental health and wellbeing, acceptability was conceptualized as: first, REACH, that is, the willingness of people to access the app and create an account; and second, UPTAKE, those who initiate use of the interventional content. Over a six-year period (06/08/2021 and 04/12/2026), 516,489 individuals created accounts on UpLife, indicating the app's reach. Of these, 184,828 (35.79%) UpLife app users went beyond creating an account and used the app for some period; a positive indication of uptake among those who reached the app and created an account.
There are 10,000+ mental health apps across app stores, and by this number alone, the raw reach is very large, comparable to that of mainstream consumer apps. In a recent study, 41% of people in a general population sample used a mental health app in the past year, suggesting that these apps are no longer niche and reach people outside clinical settings (Fürtjes et al., 2024). This finding is comparable to the UpLife app's 36% uptake.
Mental health apps are particularly good at reaching underserved populations (no therapist access, long waitlists), people with mild or emerging symptoms and users looking for self-help tools (meditation, mood tracking, stress relief) (Fürtjes et al., 2024). With such large numbers of individuals accessing the various app stores and seeking solutions for different mental health and wellbeing issues they are experiencing and in addition considering the wide geography of users is a testament to the need for mental health support in the population and also the nature of help-seeking in the population, especially in places where mental health services either do not exist or minimally exist, or in times of crisis, such as a war, there is a large burden placed on services and a real and immediate need for mental health intervention (as would be the case for some participants from some countries on the list in Appendix B).
Engagement
The present analysis examined user engagement patterns across three curated digital mental health journeys, revealing highly structured engagement behaviors characterized by pronounced clustering at specific time points, particularly Days 7 and 12. These findings suggest that user interaction with the intervention is not continuous but instead closely aligned with the program's underlying temporal and content architecture.
A key observation is the substantial concentration of users at Day 7 across all journeys, most notably in Journey 1, where 43.5% of users reached this point. The secondary clustering at Day 12 across all journeys further supports the interpretation that engagement is driven by program structure rather than organic user behaviour. Similar "milestone effects" have been documented in modular eHealth interventions, where users tend to disengage at the boundaries of predefined content units (Donkin et al., 2011). This suggests that users may perceive these points as natural stopping cues, particularly in the absence of compelling prompts to continue. The relatively higher proportion of users reaching Day 12 in Journey 2 (31.4%) compared to Journey 1 indicates that differences in content pacing or design may meaningfully influence sustained engagement.
Clinical effectiveness
Finally, the hypothesis regarding clinical effectiveness is supported, as participants who engaged with the intervention and provided outcome data demonstrated clinically meaningful improvements in measures of depression and anxiety. This is in line with a growing body of evidence indicating that digital mental health interventions, particularly those grounded in established therapeutic approaches such as cognitive behavioral therapy, can produce significant symptom reduction (Linardon & Fuller-Tyszkiewicz, 2020).
However, it is important to interpret these findings in light of the observed engagement patterns, as clinical benefits are likely contingent on achieving a sufficient level of interaction with the intervention. Furthermore, excluding low-engagement users and those without follow-up data introduces the risk of selection bias, potentially inflating estimates of effectiveness. Taken together, the results underscore the interconnected nature of acceptability, engagement, and outcomes, and point to the need for future work to focus on improving early uptake and sustained adherence to maximize the population-level impact of digital mental health interventions.
The present study evaluated the clinical effectiveness of a digital mental health application using longitudinal linear mixed-effects models, with a particular focus on depressive symptoms (PHQ-9), anxiety symptoms (GAD-7), and well-being (WHO-5), as well as the role of user engagement. Overall, the findings provide evidence of significant reductions in depression and anxiety symptoms over time, alongside a consistent pattern linking greater engagement intensity with improved clinical outcomes, while no statistically significant improvements were observed for well-being.
Limitations
The use of linear mixed-effects models represents a strength of the study, allowing for the modelling of within-subject change over time while accounting for individual variability. However, several limitations should be considered. First, the observational nature of engagement analyses limits causal inference; more engaged users may differ systematically (e.g., in motivation or baseline severity) from less engaged users. Second, the absence of a control group constrains the ability to attribute observed improvements solely to the intervention, as natural recovery or regression to the mean cannot be ruled out.
Additionally, while statistically significant, the magnitude of engagement effects at the individual level is relatively small, suggesting that clinically meaningful improvements may require cumulative engagement across multiple journeys. This reinforces the importance of design strategies that promote sustained use, such as personalization, reminders, and behavioral nudges (Perski et al., 2017).
Conclusion
In summary, the present study demonstrates that use of the UpLife digital mental health app is associated with significant reductions in depressive and anxiety symptoms, with strong and consistent evidence of a dose–response relationship between engagement and clinical outcomes. However, well-being outcomes did not show significant improvement, highlighting potential differences in how digital interventions impact symptom reduction versus broader psychological functioning. These findings contribute to the growing evidence base supporting digital mental health tools, while emphasizing the central role of sustained and meaningful user engagement in driving clinical effectiveness.
References
- Baumel A, Torous J, Edan S, Kane JM. (2020) There is a non-evidence-based app for that: A systematic review and mixed methods analysis of depression- and anxiety-related apps that incorporate unrecognized techniques. J Affect Disord. 1;273:410-421. https://doi.org/10.1016/j.jad.2020.05.011
- Castro O, Salamanca-Sanabria A, Alattas A, Teepe GW, Leidenberger K, Fleisch E, Tudor Car L, Muller-Riemenschneider F, Kowatsch T. (2024) Top-funded companies offering digital health interventions for the prevention and treatment of depression: a systematic market analysis. Arch Public Health. 4;82(1):200. doi: 10.1186/s13690-024-01424-z.
- Donkin, L., Christensen, H., Naismith, S. L., Neal, B., Hickie, I. B., & Glozier, N. (2011). A systematic review of the impact of adherence on the effectiveness of e-therapies. Journal of Medical Internet Research, 13(3), e52. https://doi.org/10.2196/jmir.1772
- Fleming, T., Bavin, L., Lucassen, M., Stasiak, K., Hopkins, S., & Merry, S. (2018). Beyond the trial: Systematic review of real-world uptake and engagement with digital self-help interventions for depression, low mood, or anxiety. Journal of Medical Internet Research, 20(6), e199. https://doi.org/10.2196/jmir.9275
- Firth, J., Torous, J., Nicholas, J., Carney, R., Rosenbaum, S., & Sarris, J. (2017). The efficacy of smartphone-based mental health interventions for depressive symptoms: A meta-analysis of randomized controlled trials. World Psychiatry, 16(3), 287–298. https://doi.org/10.1002/wps.20472
- Fleming, T. M., Bavin, L., Stasiak, K., Hermansson-Webb, E., Merry, S. N., Cheek, C., Lucassen, M., Lau, H. M., Pollmuller, B., & Hetrick, S. (2018). Serious games and gamification for mental health: Current status and promising directions. JMIR Mental Health, 5(2), e18. https://doi.org/10.2196/mental.9115
- Fürtjes, S., Gebel, E., Kische, H. et al. Characteristic of mental health app usage: a cross-sectional survey in the general population. BMC Public Health 24, 3133 (2024). https://doi.org/10.1186/s12889-024-20500-1
- Kroenke, K., Spitzer, R. L., & Williams, J. B. W. (2001). The PHQ-9: Validity of a brief depression severity measure. Journal of General Internal Medicine, 16(9), 606–613. https://doi.org/10.1046/j.1525-1497.2001.016009606.x
- Linardon, J., & Fuller-Tyszkiewicz, M. (2020). Attrition and adherence in digital health interventions: A systematic review and meta-analysis. Journal of Consulting and Clinical Psychology, 88(1), 1–13. https://doi.org/10.1037/ccp0000459
- Perski, O., Blandford, A., West, R., & Michie, S. (2017). Conceptualising engagement with digital behaviour change interventions: A systematic review using principles from critical interpretive synthesis. Translational Behavioral Medicine, 7(2), 254–267. https://doi.org/10.1007/s13142-016-0453-1
- Torous J, Chan S, Yee-Marie Tan S, Behrens J, Mathew I, Conrad E, Hinton L, Yellowlees P, Keshavan M. (2014). Patient smartphone ownership and interest in mobile apps to monitor symptoms of mental health conditions: A survey in four geographically distinct psychiatric clinics. JMIR Ment Health 1(1):e5. https://mental.jmir.org/2014/1/e5 doi: 10.2196/mental.4004
- World Health Organization. (2022). World mental health report: Transforming mental health for all. WHO.
Appendices
Appendix A: History of UpLife
UpLife Inc. was founded in 2019 by Oleksander Makhtin and Oleg Lavrentyev with clinical advisor Natalia Kuzmina. The company provides a digital mental health and self-therapy platform designed to help people improve their emotional well-being, build healthier thinking patterns, and develop positive daily habits through structured psychological programs and daily practices. For therapists, UpLife extends therapy beyond sessions, enabling them to guide clients between meetings through structured digital programs and progress tracking.
The first consumer-facing release occurred in 2021 and focused on market validation to establish an MVP. Then, in 2022, user growth ramped up while the product roadmap was implemented to include personalisation and greater content. This led to a phase of growth, with product-market fit supported by customer purchases. Throughout 2023 and 2024, the company grew its user base and continued to enhance and refine the product, focusing on clinical outcomes that could be measured and incorporating additional evidence-based content and interactive elements.
With over 500K users (cumulative), the company expanded its team, adding Jeff Musa as an advisor and now CEO, and adding Dr Lloyd Humphreys and Pat Ryan (LCSW) as advisors. The market focus has evolved from a consumer app to a therapist-facing mental help platform that includes a secure portal, client management and data sharing, analytics and collaborative plans, treatment pathways with assessments, and a Blended Care Therapy model.
Appendix B: Participants' countries of origin
N=62,428 provided this information.
Show the full country breakdown
| Country | N | % |
|---|---|---|
| Afghanistan | 16 | .0 |
| Åland Islands | 3 | .0 |
| Albania | 52 | .0 |
| Algeria | 124 | .1 |
| Andorra | 7 | .0 |
| Angola | 6 | .0 |
| Anguilla | 1 | .0 |
| Antigua and Barbuda | 9 | .0 |
| Argentina | 79 | .0 |
| Armenia | 73 | .0 |
| Aruba | 12 | .0 |
| Australia | 2,055 | 1.1 |
| Austria | 203 | .1 |
| Azerbaijan | 107 | .1 |
| Bahamas | 12 | .0 |
| Bahrain | 14 | .0 |
| Bangladesh | 191 | .1 |
| Barbados | 30 | .0 |
| Belarus | 418 | .2 |
| Belgium | 280 | .2 |
| Belize | 17 | .0 |
| Benin | 8 | .0 |
| Bermuda | 6 | .0 |
| Bhutan | 15 | .0 |
| Bolivia | 8 | .0 |
| Bosnia and Herzegovina | 73 | .0 |
| Botswana | 93 | .1 |
| Brazil | 170 | .1 |
| British Virgin Islands | 3 | .0 |
| Brunei | 6 | .0 |
| Bulgaria | 149 | .1 |
| Burkina Faso | 2 | .0 |
| Burundi | 3 | .0 |
| Cambodia | 26 | .0 |
| Cameroon | 45 | .0 |
| Canada | 6,061 | 3.3 |
| Caribbean Netherlands | 1 | .0 |
| Cayman Islands | 5 | .0 |
| Chile | 38 | .0 |
| China | 9 | .0 |
| China mainland | 1 | .0 |
| Colombia | 82 | .0 |
| Congo | 1 | .0 |
| Congo (DRC) | 4 | .0 |
| Costa Rica | 43 | .0 |
| Croatia | 188 | .1 |
| Curaçao | 6 | .0 |
| Cyprus | 74 | .0 |
| Czech Republic | 539 | .3 |
| Denmark | 153 | .1 |
| Djibouti | 5 | .0 |
| Dominica | 8 | .0 |
| Dominican Republic | 35 | .0 |
| East Timor | 1 | .0 |
| Ecuador | 29 | .0 |
| Egypt | 403 | .2 |
| El Salvador | 5 | .0 |
| Equatorial Guinea | 2 | .0 |
| Estonia | 115 | .1 |
| Ethiopia | 127 | .1 |
| Falkland Islands | 1 | .0 |
| Fiji | 14 | .0 |
| Finland | 163 | .1 |
| France | 688 | .4 |
| French Guiana | 1 | .0 |
| French Polynesia | 2 | .0 |
| Gabon | 3 | .0 |
| Gambia | 12 | .0 |
| Georgia | 140 | .1 |
| Germany | 2,217 | 1.2 |
| Ghana | 227 | .1 |
| Greece | 200 | .1 |
| Greenland | 1 | .0 |
| Grenada | 8 | .0 |
| Guadeloupe | 3 | .0 |
| Guam | 18 | .0 |
| Guatemala | 11 | .0 |
| Guernsey | 5 | .0 |
| Guinea | 1 | .0 |
| Guyana | 12 | .0 |
| Haiti | 6 | .0 |
| Honduras | 6 | .0 |
| Hong Kong | 68 | .0 |
| Hungary | 141 | .1 |
| Iceland | 19 | .0 |
| India | 3,549 | 1.9 |
| Indonesia | 355 | .2 |
| Iraq | 118 | .1 |
| Ireland | 209 | .1 |
| Isle of Man | 3 | .0 |
| Israel | 149 | .1 |
| Italy | 430 | .2 |
| Ivory Coast | 14 | .0 |
| Jamaica | 149 | .1 |
| Japan | 85 | .0 |
| Jersey | 4 | .0 |
| Jordan | 37 | .0 |
| Kazakhstan | 705 | .4 |
| Kenya | 484 | .3 |
| Kosovo | 34 | .0 |
| Kuwait | 30 | .0 |
| Kyrgyzstan | 184 | .1 |
| Laos | 4 | .0 |
| Latvia | 126 | .1 |
| Lebanon | 65 | .0 |
| Lesotho | 30 | .0 |
| Liberia | 12 | .0 |
| Libya | 11 | .0 |
| Liechtenstein | 1 | .0 |
| Lithuania | 161 | .1 |
| Luxembourg | 21 | .0 |
| Macau | 6 | .0 |
| Macedonia | 44 | .0 |
| Madagascar | 28 | .0 |
| Malawi | 51 | .0 |
| Malaysia | 346 | .2 |
| Maldives | 25 | .0 |
| Malta | 30 | .0 |
| Martinique | 1 | .0 |
| Mauritania | 1 | .0 |
| Mauritius | 47 | .0 |
| Mayotte | 1 | .0 |
| Mexico | 176 | .1 |
| Micronesia | 1 | .0 |
| Moldova | 189 | .1 |
| Mongolia | 20 | .0 |
| Montenegro | 24 | .0 |
| Morocco | 147 | .1 |
| Mozambique | 10 | .0 |
| Myanmar (Burma) | 35 | .0 |
| Namibia | 71 | .0 |
| Nepal | 136 | .1 |
| Netherlands | 519 | .3 |
| New Caledonia | 3 | .0 |
| New Zealand | 314 | .2 |
| Nicaragua | 6 | .0 |
| Nigeria | 590 | .3 |
| Northern Mariana Islands | 3 | .0 |
| Norway | 273 | .1 |
| Oman | 26 | .0 |
| Pakistan | 574 | .3 |
| Palau | 1 | .0 |
| Palestine | 17 | .0 |
| Panama | 7 | .0 |
| Papua New Guinea | 24 | .0 |
| Paraguay | 9 | .0 |
| Peru | 28 | .0 |
| Philippines | 2,251 | 1.2 |
| Poland | 1,904 | 1.0 |
| Portugal | 194 | .1 |
| Puerto Rico | 49 | .0 |
| Qatar | 29 | .0 |
| Réunion | 8 | .0 |
| Romania | 477 | .3 |
| Russia | 368 | .2 |
| Rwanda | 17 | .0 |
| Saint Kitts and Nevis | 4 | .0 |
| Saint Lucia | 9 | .0 |
| Saint Martin | 1 | .0 |
| Saudi Arabia | 127 | .1 |
| Senegal | 14 | .0 |
| Serbia | 119 | .1 |
| Seychelles | 9 | .0 |
| Sierra Leone | 19 | .0 |
| Singapore | 116 | .1 |
| Sint Maarten | 1 | .0 |
| Slovakia | 222 | .1 |
| Slovenia | 94 | .1 |
| Solomon Islands | 1 | .0 |
| Somalia | 31 | .0 |
| South Africa | 986 | .5 |
| South Korea | 60 | .0 |
| South Sudan | 11 | .0 |
| Spain | 428 | .2 |
| Sri Lanka | 96 | .1 |
| St. Vincent & Grenadines | 6 | .0 |
| Suriname | 21 | .0 |
| Swaziland | 26 | .0 |
| Sweden | 276 | .1 |
| Switzerland | 198 | .1 |
| Syria | 1 | .0 |
| Taiwan | 43 | .0 |
| Tajikistan | 48 | .0 |
| Tanzania | 107 | .1 |
| Thailand | 106 | .1 |
| Togo | 2 | .0 |
| Trinidad and Tobago | 84 | .0 |
| Tunisia | 89 | .0 |
| Turkey | 272 | .1 |
| Turkmenistan | 44 | .0 |
| Turks and Caicos Islands | 3 | .0 |
| U.S. Virgin Islands | 6 | .0 |
| Uganda | 108 | .1 |
| Ukraine | 28,846 | 15.6 |
| United Arab Emirates | 151 | .1 |
| United Kingdom | 2,911 | 1.6 |
| United States | 54,047 | 29.2 |
| Uruguay | 15 | .0 |
| Uzbekistan | 222 | .1 |
| Vanuatu | 3 | .0 |
| Venezuela | 16 | .0 |
| Vietnam | 99 | .1 |
| Yemen | 4 | .0 |
| Zambia | 163 | .1 |
| Zimbabwe | 89 | .0 |
| Listed above | 122,622 | — |
Appendix C: Ages as collected on the platform over time
| Age range | N | % |
|---|---|---|
| 13–17 | 2,028 | 1.1 |
| 13–19 | 8 | .0 |
| 18–24 | 479 | .3 |
| 18–29 | 2,915 | 1.6 |
| 20–29 | 9 | .0 |
| 25–34 | 543 | .3 |
| 30–39 | 1,637 | .9 |
| 35–44 | 387 | .2 |
| 40–49 | 910 | .5 |
| 40+ | 8 | .0 |
| 45–54 | 149 | .1 |
| 45-54 | 3 | .0 |
| 50+ | 451 | .2 |
| 55–64 | 46 | .0 |
| 65+ | 19 | .0 |
| secret | 17 | .0 |
| Total | 185,050 | 100.0 |
Appendix D: Types of journeys users completed
- A Healthy Self-esteem
- Accepting your weight, age & look
- Anger management
- Anti-Stress
- Be Happy in your Relationship
- Discovering Your Potential
- Emotional Intelligence
- Finding your purpose
- From Fear to a New Life
- Getting Out of a Codependent Relationship
- Getting Over a Breakup
- Guilt and Conscience
- Health Through Physical and Mental Harmony
- Letting the past go to move into the future
- Love your imperfection
- Mental Weight Loss
- On the way to my dream
- Overcome Fear and Start Living
- Overcoming ADHD
- Overcoming Anxiety
- Overcoming Personal Crisis
- Overcoming Trauma
- Overcoming Trauma (UA)
- Panic Attacks - How to Survive and Win
- Personal Boundaries
- Personal Effectiveness and Inspiration
- Post-traumatic Growth
- Recognizing and Neutralizing Manipulation
- Recovering From Depression
- Rediscover the Joy of Living
- Relationships and sex
- Sleep well
- Survivor Guilt Complex
- The 7 Principles of a Happy Life
- The Power of Being. Resilience.
© UpLife Inc 2026. All rights reserved. For questions about this report, contact inquiry@uplifecare.com.
Suggested citation: RED Digital Health Consulting (2026). Observational pre-post evaluation using real-world data examining the acceptability, engagement, and effectiveness of the UpLife digital mental health app among general users in the population. Commissioned by UpLife Inc.